Let’s start with some history, shall we?
Everyone knows there is a “halving” every four years, where the number of Bitcoin mined is reduced by half. The most recent halving was on April 20, 2024. The previous halving was May 11, 2020.
What happened after the May 11, 2020 halving?
On May 7, 2020, four days before the halving, Bitcoin peaked at around $10,076. 18 days later, Bitcoin had dropped almost 15% to around $8,590.
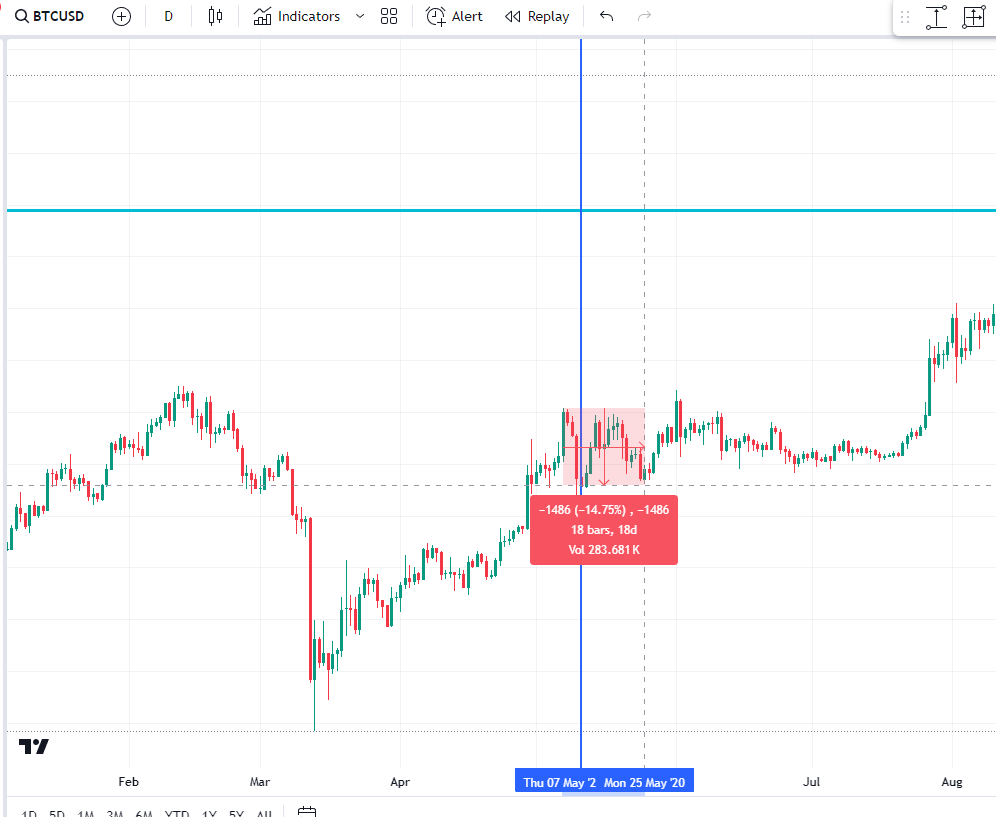
What’s my point? It is not unusual for Bitcoin to advance before the halving and then drop thereafter. It’s “buy the rumour, sell the news.”
Of equal interest on this chart from 2020: From the bottom on March 13, 2020, to just before the halving, Bitcoin was up 164% (in less than one month).
Which brings us to the current day.
Bitcoin bottomed in September 2023 at around $25,000 and then exploded almost 200% over the next 185 days, hitting a new all-time high of over $73,000. Never before had Bitcoin made a new all-time high immediately before a halving.
Of course, every commentator said, “See, this time it’s different. The halving will cause Bitcoin to hit $100,000 immediately!”
That didn’t happen.
The new ETFs in January 2024 increased demand, leading to a new all-time high. But the halving was still a “buy the rumour, sell the news” event.
Bitcoin declined slightly into the halving on April 20, 2024, and increased slightly in the days after. Still, from April 22 to May 1, Bitcoin dropped 16%, roughly the same decline over the same period as we experienced in 2020.
We all know what happened after 2020. Bitcoin went on a run and made two highs; the rest is history.
So now what?
My assumption is now that the halving is in the rearview mirror, Bitcoin is free to run.
It won’t all be smooth sailing. After the initial excitement surrounding the ETFs, money flowed into them, but fund flows have turned negative.
Why? Because the initial investors thought Bitcoin would go up in a straight line, and when it didn’t, they sold. That’s normal.
Here are the forces I’m seeing now:
First, ETF flows are negative, but that is a function of price. If Bitcoin makes a new all-time high, it will be back in the news, and funds will flow.
Second, Bitcoin remains in a downtrend channel that started at the all-time high on March 14, 2024. It dipped briefly below the channel but is back in it, with an upper resistance level of $72,000. If Bitcoin breaks below $56,000, then $52,000 and $49,000 are the next support levels. I don’t expect Bitcoin to fall to those levels, but it will be a great buying opportunity if it does.
Third, the green uptrend line that started on December 6, 2023 is now acting as resistance. If Bitcoin can close for a day above $64,000, the line will flip from resistance to support.
Finally, the next resistance level is the all-time high from November 2021 at $69,000. It will be resistance, but again, if it’s breached, then another all-time high is in focus.
My guess is that the Fed will eventually realize the economy is soft and cut interest rates before the US election in November. (Canada will likely cut in June or September because the Canadian economy is much weaker.) When that happens, Bitcoin (and the stock market) will go up, just as they did during the last loosening cycle.
To conclude, I don’t expect new all-time highs this week or this month, but I remain firmly convinced that we will see $100,000 Bitcoin before the end of the year.
Do what you wish with that information.
Thanks for reading; see you next week.
Bitcoin: Interesting Price Action
by JDH on May 4, 2024
Let’s start with some history, shall we?
Everyone knows there is a “halving” every four years, where the number of Bitcoin mined is reduced by half. The most recent halving was on April 20, 2024. The previous halving was May 11, 2020.
What happened after the May 11, 2020 halving?
On May 7, 2020, four days before the halving, Bitcoin peaked at around $10,076. 18 days later, Bitcoin had dropped almost 15% to around $8,590.
What’s my point? It is not unusual for Bitcoin to advance before the halving and then drop thereafter. It’s “buy the rumour, sell the news.”
Of equal interest on this chart from 2020: From the bottom on March 13, 2020, to just before the halving, Bitcoin was up 164% (in less than one month).
Which brings us to the current day.
Bitcoin bottomed in September 2023 at around $25,000 and then exploded almost 200% over the next 185 days, hitting a new all-time high of over $73,000. Never before had Bitcoin made a new all-time high immediately before a halving.
Of course, every commentator said, “See, this time it’s different. The halving will cause Bitcoin to hit $100,000 immediately!”
That didn’t happen.
The new ETFs in January 2024 increased demand, leading to a new all-time high. But the halving was still a “buy the rumour, sell the news” event.
Bitcoin declined slightly into the halving on April 20, 2024, and increased slightly in the days after. Still, from April 22 to May 1, Bitcoin dropped 16%, roughly the same decline over the same period as we experienced in 2020.
We all know what happened after 2020. Bitcoin went on a run and made two highs; the rest is history.
So now what?
My assumption is now that the halving is in the rearview mirror, Bitcoin is free to run.
It won’t all be smooth sailing. After the initial excitement surrounding the ETFs, money flowed into them, but fund flows have turned negative.
Why? Because the initial investors thought Bitcoin would go up in a straight line, and when it didn’t, they sold. That’s normal.
Here are the forces I’m seeing now:
First, ETF flows are negative, but that is a function of price. If Bitcoin makes a new all-time high, it will be back in the news, and funds will flow.
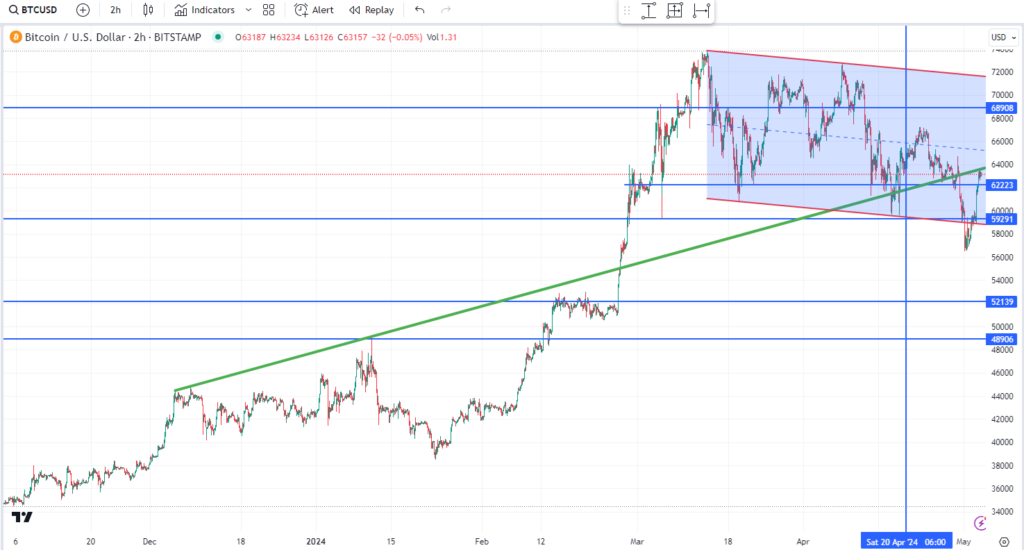
Second, Bitcoin remains in a downtrend channel that started at the all-time high on March 14, 2024. It dipped briefly below the channel but is back in it, with an upper resistance level of $72,000. If Bitcoin breaks below $56,000, then $52,000 and $49,000 are the next support levels. I don’t expect Bitcoin to fall to those levels, but it will be a great buying opportunity if it does.
Third, the green uptrend line that started on December 6, 2023 is now acting as resistance. If Bitcoin can close for a day above $64,000, the line will flip from resistance to support.
Finally, the next resistance level is the all-time high from November 2021 at $69,000. It will be resistance, but again, if it’s breached, then another all-time high is in focus.
My guess is that the Fed will eventually realize the economy is soft and cut interest rates before the US election in November. (Canada will likely cut in June or September because the Canadian economy is much weaker.) When that happens, Bitcoin (and the stock market) will go up, just as they did during the last loosening cycle.
To conclude, I don’t expect new all-time highs this week or this month, but I remain firmly convinced that we will see $100,000 Bitcoin before the end of the year.
Do what you wish with that information.
Thanks for reading; see you next week.